Anscombify
statistics
R
ShinyApp
A ShinyApp to turn images into scatterplots with the means, variances and covariance of the Anscombe Quartet.
Visualise your data!
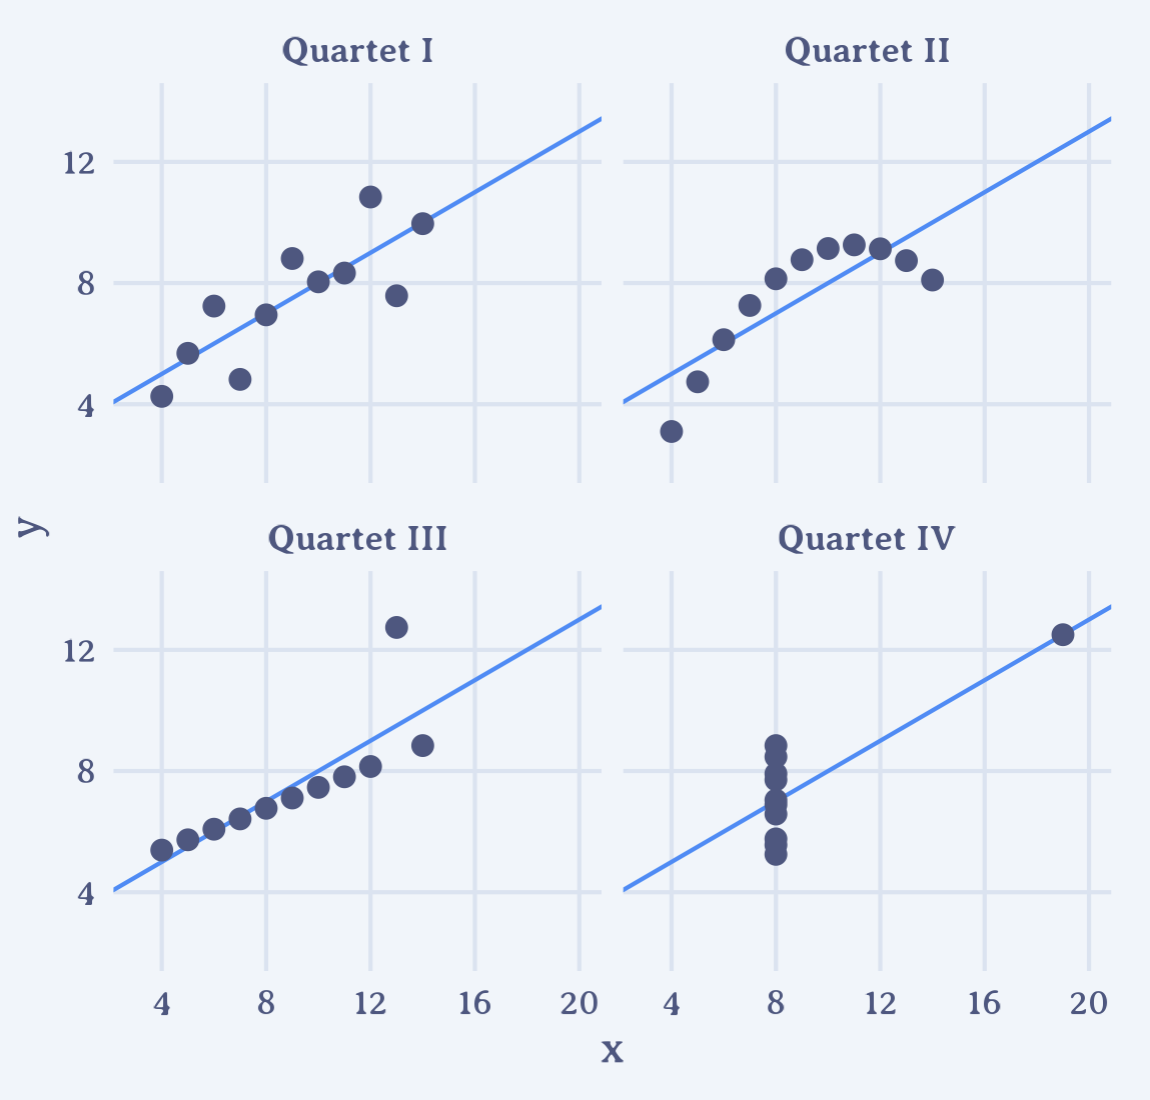
That’s the message of Anscombe’s Quartet. It’s something that professors have drilled into the heads of generations of budding scientists. Even if you’re unfamiliar with the name, chances are you’ve seen Anscombe’s Quartet before. It really is a cornerstone of statistical pedagogy. Unfortunately, it’s also quite boring and ugly. Sorry!
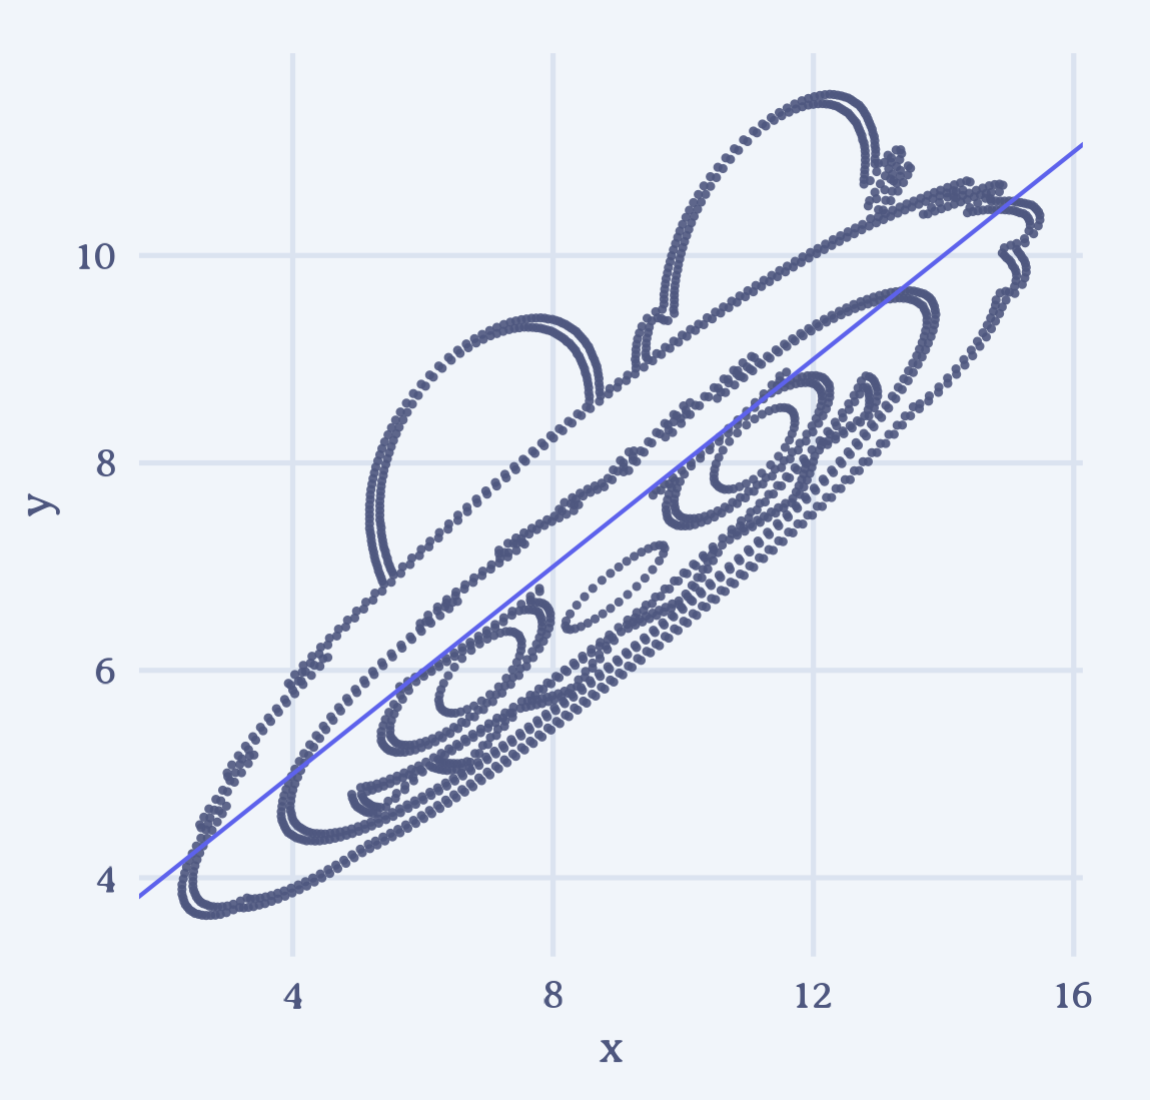
Anscombify is a ShinyApp that turns an image of your choosing (or a lovely Labubu) into a scatterplot with the means, variances and covariance of the original quartet.
NoteYou can access Anscombify below or through Posit Cloud (opens a new tab)